VIRTUS INVESTMENT PARTNERS (VRTS)·Q4 2025 Earnings Summary
Virtus Q4 2025: Outflows Accelerate as Quality-Growth Strategies Fall Out of Favor
February 6, 2026 · by Fintool AI Agent
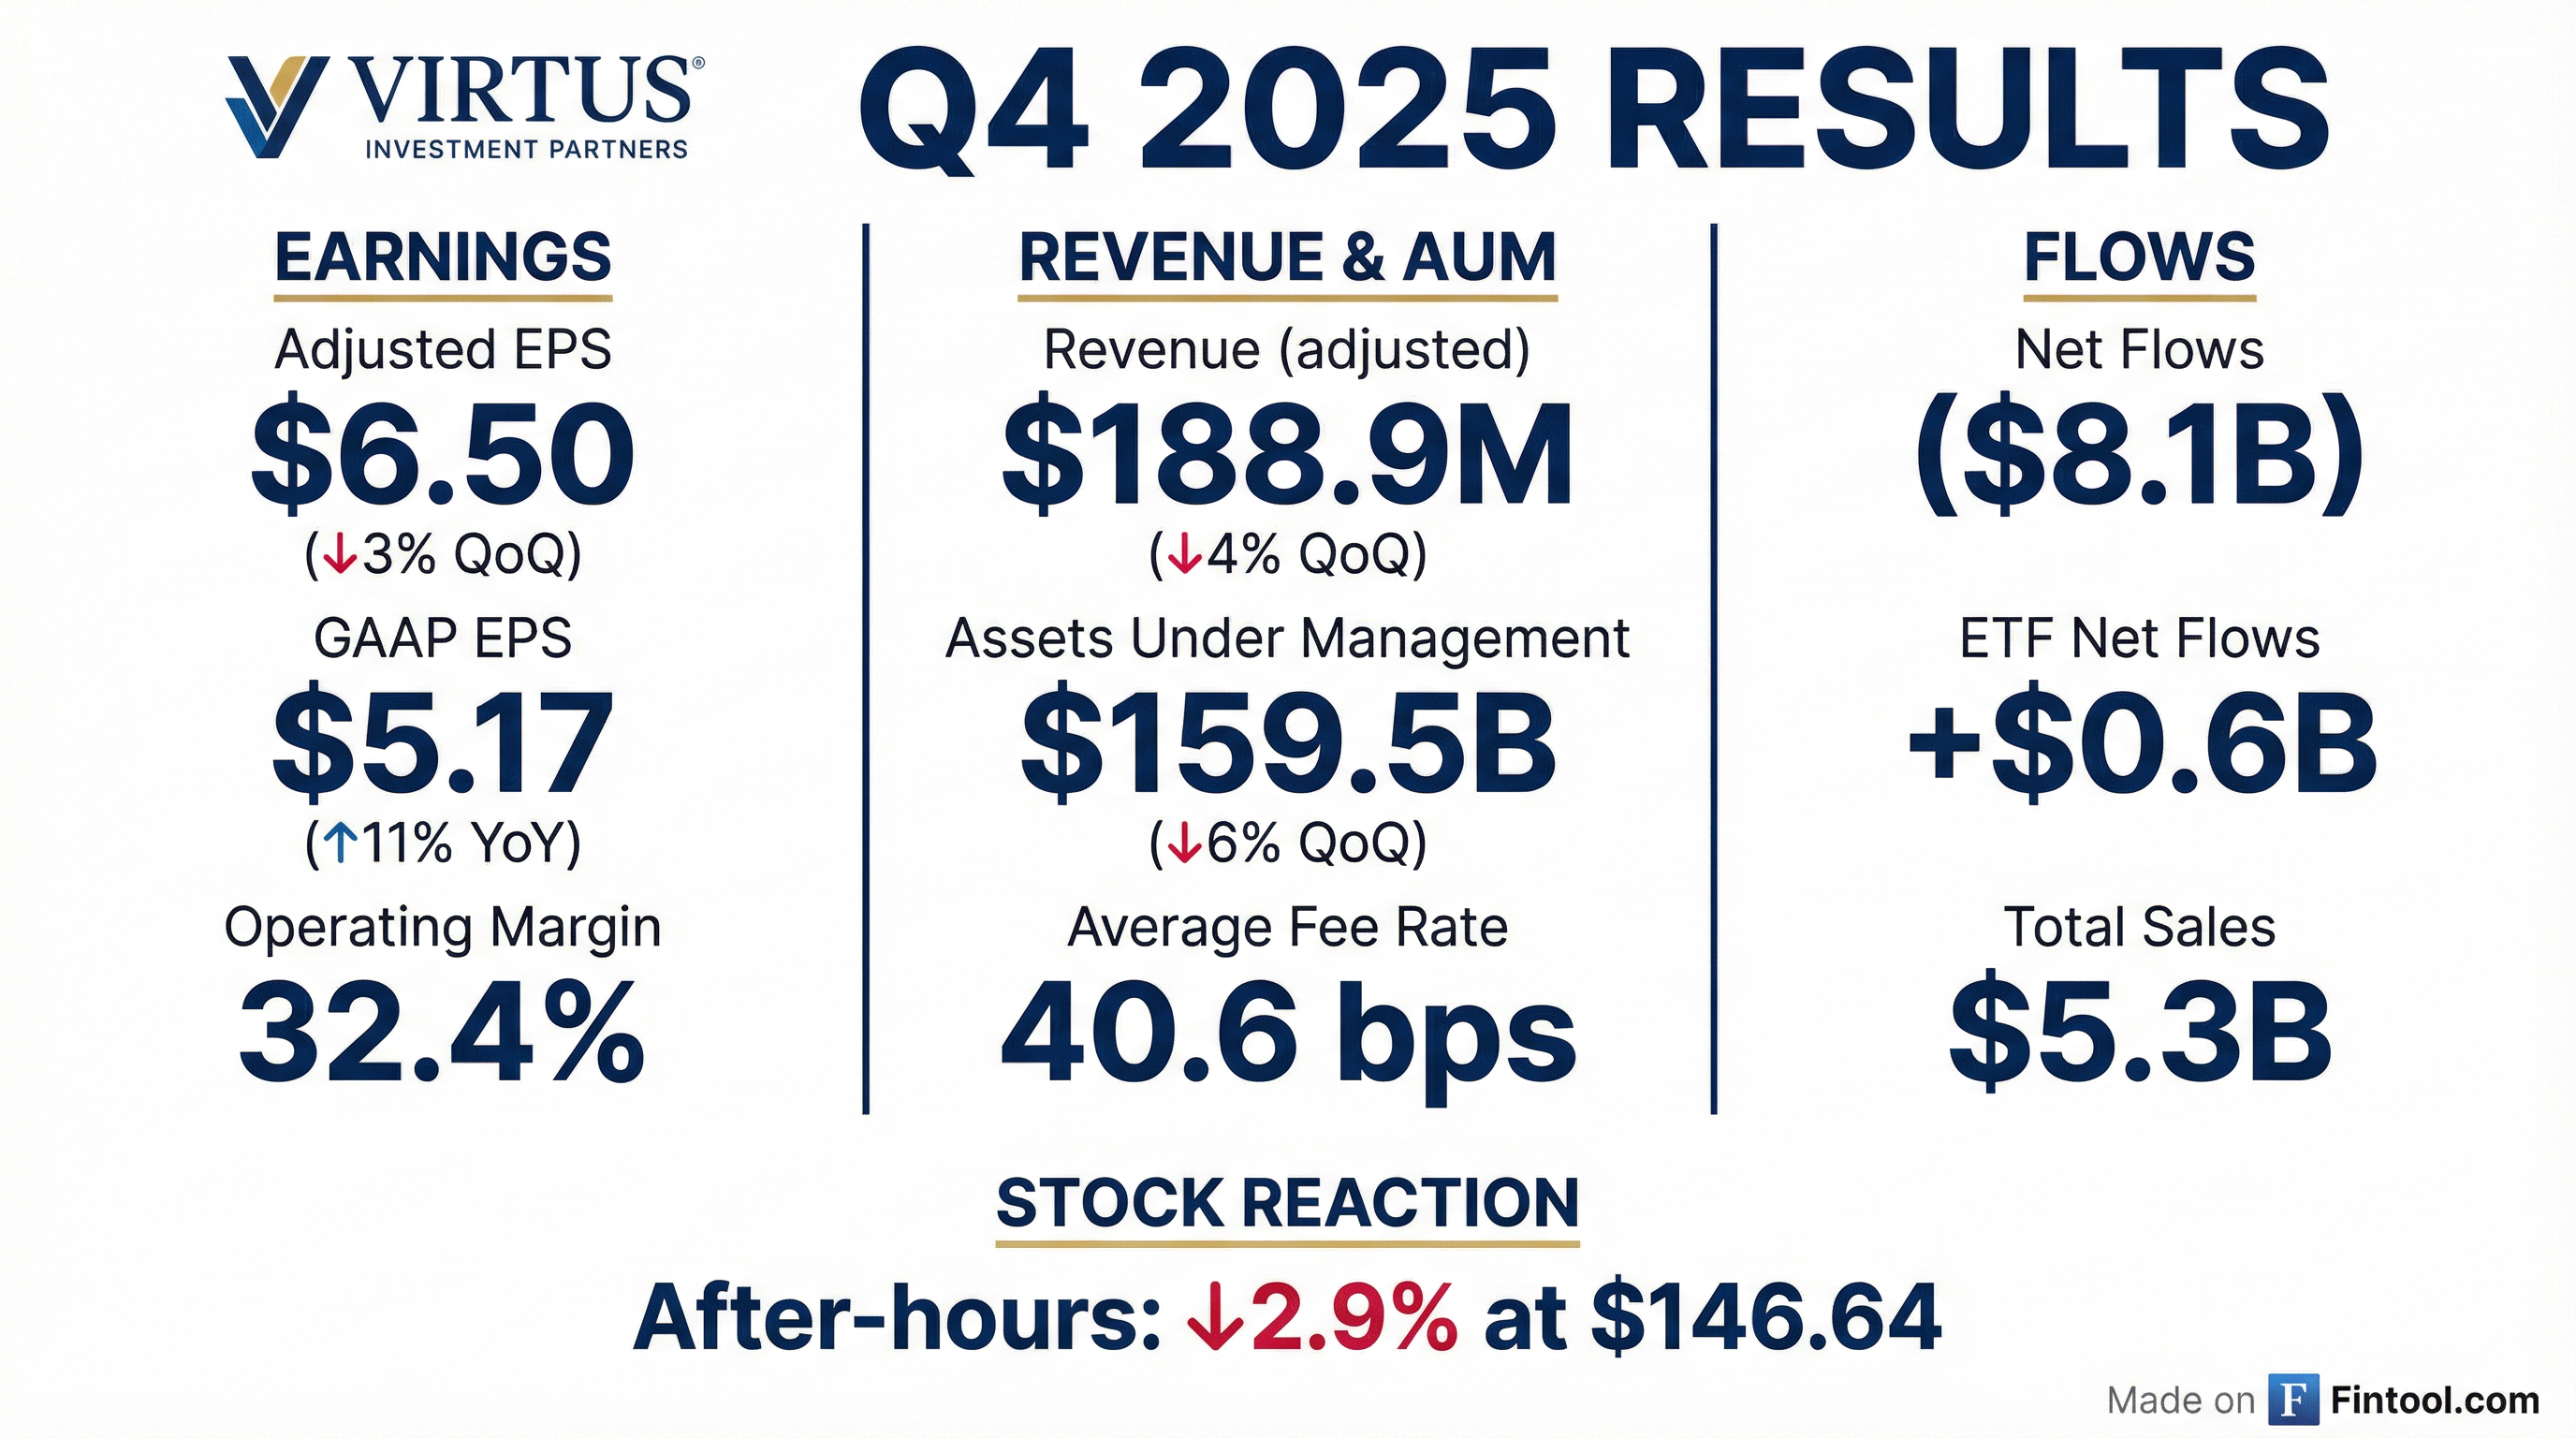
Virtus Investment Partners (NYSE: VRTS) delivered a disappointing Q4 2025 as outflows more than doubled from the prior quarter and both earnings and revenue came in below expectations. Adjusted EPS of $6.50 declined 3% sequentially as assets under management fell to $159.5B — the lowest level in over two years. The stock is trading down 3.2% to $146.09 as of midday February 6.
Did Virtus Beat Earnings?
No — Virtus missed on both revenue and EPS.
The decline was entirely driven by lower average assets under management, which fell to $165.2B from $170.3B in Q3. Average fee rate compressed modestly to 40.6 bps from 41.2 bps.
How Did the Stock React?
VRTS closed at $150.96 on February 5 and is trading down 3.2% to $146.09 as of midday February 6 following the earnings release.
The stock is now down:
- 30% from its 52-week high of $215.06
- 8% below its 50-day moving average of $164.51
- 15% below its 200-day moving average of $177.61
What Changed From Last Quarter?
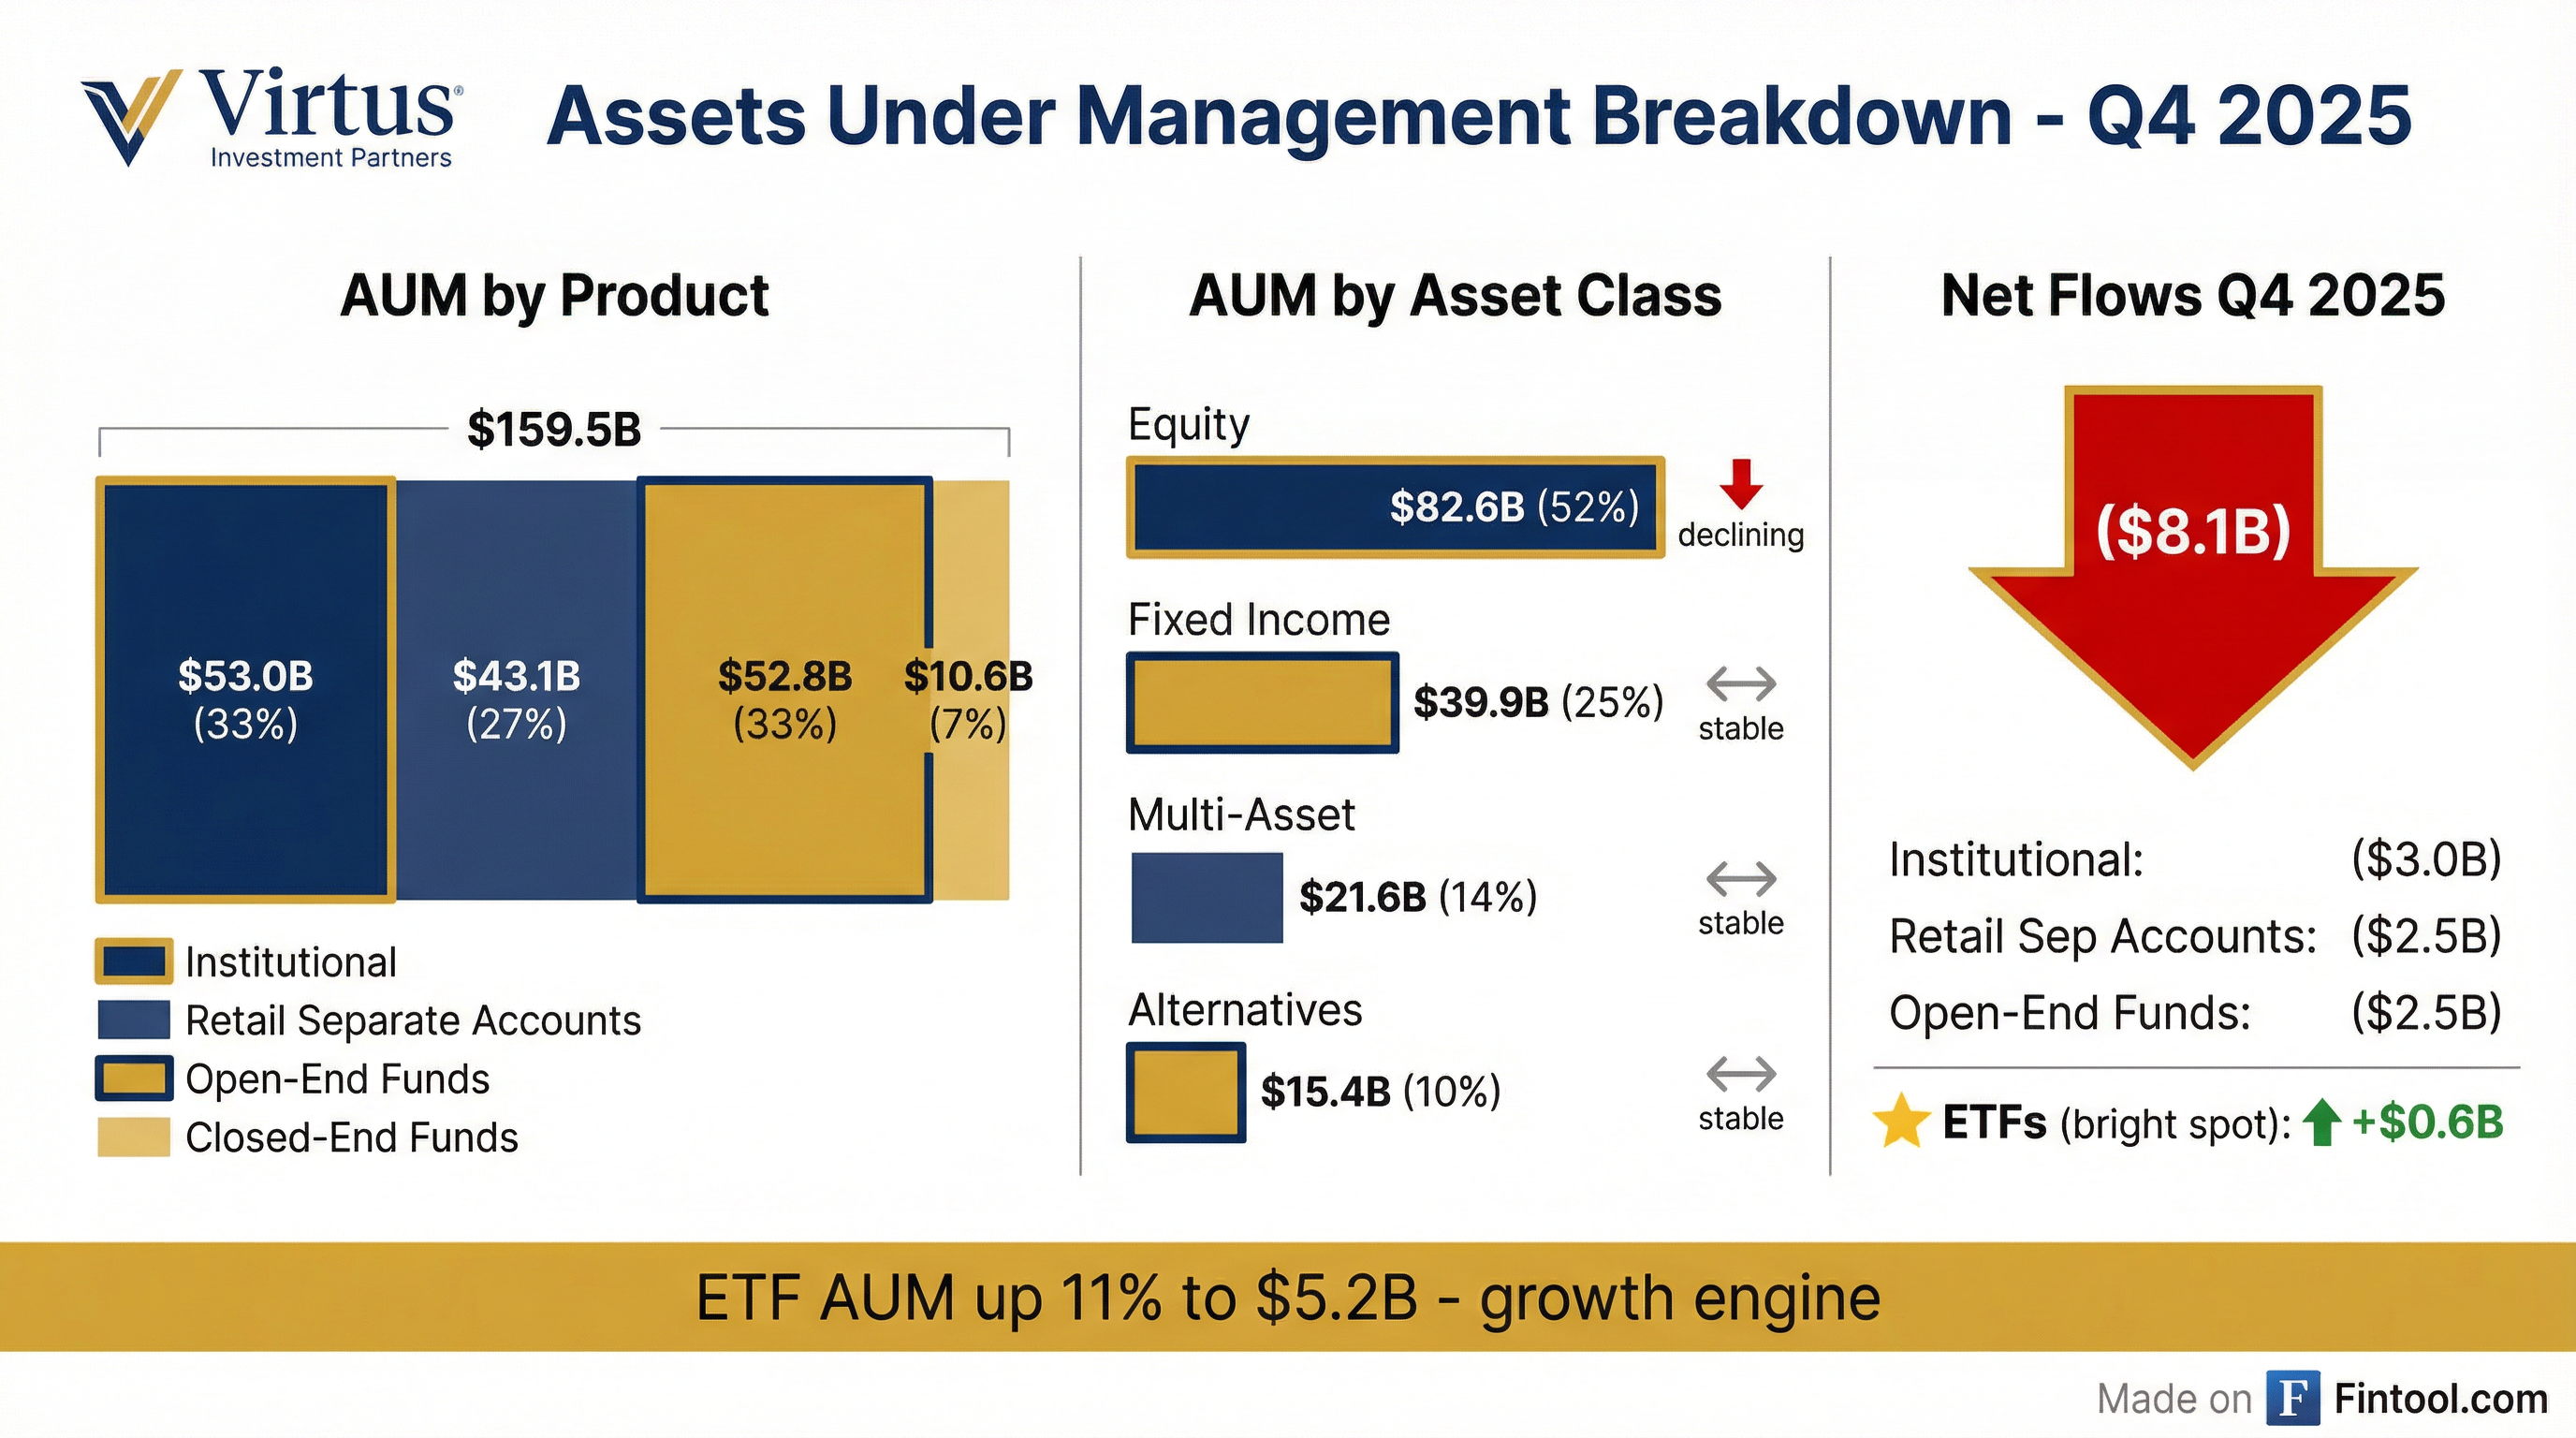
Outflows accelerated dramatically. Net flows deteriorated to ($8.1B) from ($3.9B) in Q3 — a 110% worsening.
The culprit: quality-oriented equity strategies. Large-cap growth saw heavy institutional redemptions, while small- and smid-cap strategies drove retail separate account outflows.
What Did Management Highlight?
M&A Activity — Expanding Into Private Markets
Management highlighted two strategic moves to diversify into private credit:
Keystone National Group — Acquiring 56% majority interest
- $200M at closing + up to $170M deferred/earnout
- $2.5B in private credit assets (equipment finance, real estate, asset-based lending)
- Expected to add ~$1.50 to 2026 EPS
- Closing expected March 1, 2026
Crescent Cove Advisors — Acquired 35% minority stake for $40M
- $1.0B in private markets assets
- Focuses on middle-market technology lending
- Complements existing capabilities
"Diversifies capabilities with expansion into private markets... significant growth opportunity with established presence in the RIA channel."
ETFs — The Bright Spot
ETF AUM increased 11% to $5.2B with $0.6B of positive net flows. Sales of $0.8B were consistent with the prior quarter. This remains the key growth engine.
Capital Return
- Repurchased $10M of shares (60,292 shares at avg. $165.82)
- Declared $2.40 per share dividend (unchanged)
- Net debt of just $12.5M (0.0x EBITDA) — conservative balance sheet
Full-Year 2025 Summary
Full-year 2025 was challenging. Net outflows of $18.9B nearly doubled from 2024, driven by equity strategy headwinds throughout the year. The operating margin compressed to 31.1% from 32.6%.
Investment Performance — A Concern
Investment performance has deteriorated, which may explain the outflow acceleration:
Only 24% of AUM is outperforming benchmarks on a 1-year basis, down from 37% a year ago. Equity performance is particularly weak at just 6% outperforming on a 1-year basis.
Forward Estimates
Analyst consensus for the next 4 quarters:
*Values retrieved from S&P Global
Note: Keystone National acquisition ($1.50 EPS contribution) is not yet reflected in all estimates.
Key Risks and Concerns
- Equity outflows may persist — Quality-growth strategies remain out of favor with rates elevated
- Investment performance — Only 24% of AUM beating benchmarks on 1-year basis
- Fee compression — Average fee rate declined to 40.6 bps from 42.0 bps a year ago
- Acquisition execution — Keystone adds complexity; integration risk exists
- Market sensitivity — AUM highly exposed to equity market performance (52% equity)
Q&A Highlights
On Fee Rate Trajectory (Barclays): Management noted the normalized Q4 fee rate was 40.9 bps after adjusting for discrete ETF expenses. Q1 2026 guidance of 41-42 bps reflects one month of Keystone impact with closing expected March 1. Beyond Q1, fee rate expected to be 43-45 bps as Keystone's higher-margin private credit ($2.5B at close) contributes fully.
On Tech Exposure and DeepSeek Impact (Piper Sandler): Virtus is "generally underweight exposure to technology" across the complex. CEO Aylward noted the recent tech sell-off was "actually very good for many of our managers." Crescent Cove doesn't have holdings at risk of AI disintermediation.
On Keystone Go-to-Market (TD Cowen): Sales teams are already trained and "very excited" ahead of the March 1 close. Initial focus is expanding Keystone's existing wealth management channel presence, with institutional opportunities to follow. The fund is already retail-ready and used by established wealth management firms.
On Capital Deployment (TD Cowen): Management emphasized a balanced approach: continued stock repurchases (8 consecutive annual dividend increases), maintaining reasonable leverage, and opportunistic M&A only when "truly additive." The M&A pipeline still exists but takes a backseat after closing two transactions.
January Early Indicators
Management provided encouraging early Q1 commentary:
- January sales at highest level since June
- January net flows at best level since September
- Fixed income net flows turned positive
- ETF flows continue strong
However, institutional trends remain challenging with known redemptions still exceeding known wins.
Guidance Summary
What Management Avoided
Management did not provide specific full-year 2026 EPS or revenue guidance. There was no discussion of potential cost cuts despite declining revenues. The call focused heavily on M&A as the path to growth, with limited commentary on organic flow improvement initiatives beyond diversifying into non-quality-oriented strategies.
Bottom Line
Virtus delivered a disappointing Q4 with accelerating outflows, margin pressure, and deteriorating investment performance. The Keystone National acquisition (closing March 1) provides a pathway into higher-margin private credit and should boost EPS by ~$1.50 in 2026 — but organic trends remain challenging. January showed improvement with the best flows since September, though institutional redemptions continue to outpace wins. With the stock down 3.2% to $146 and trading near 52-week lows, the market is waiting for evidence that quality equities can come back into favor.
This analysis was generated by Fintool AI Agent based on SEC filings, earnings materials, and market data.